Stellar Makes Epic Comeback Breaking 50-Day and 200-Day EMA Resistance

- Stellar (XLM) made a phenomenal comeback as the price breached the 50-day and 200-day EMA mark
- XLM MACD is positive with a green histogram, and the MACD and signal line are heading in the upward direction
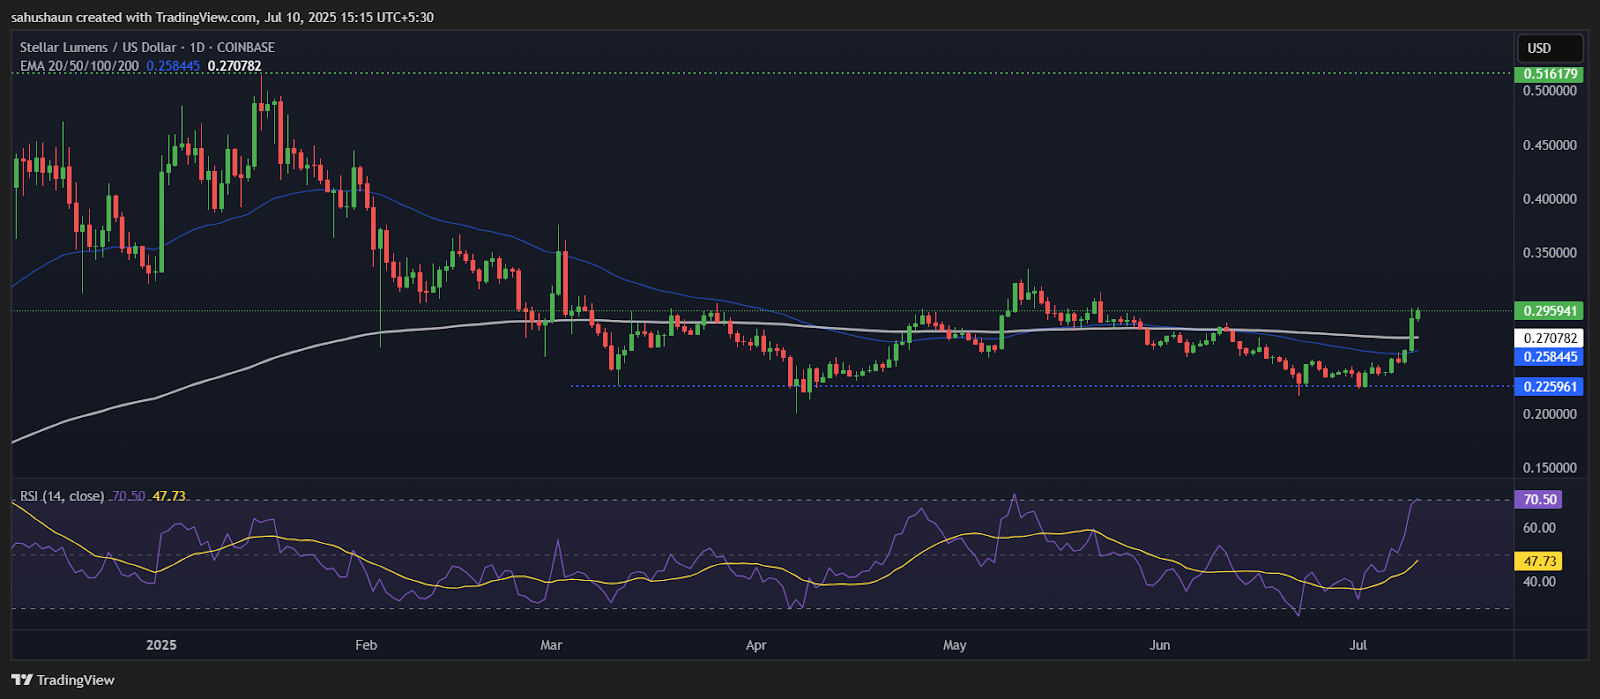
Stellar (XLM) has shown an incredible recovery, surpassing key resistance points with strong momentum. The altcoin has managed to break the 50-day and 200-day EMAs, which is a major technical achievement, indicating a possible reversal of the earlier bearish mood.
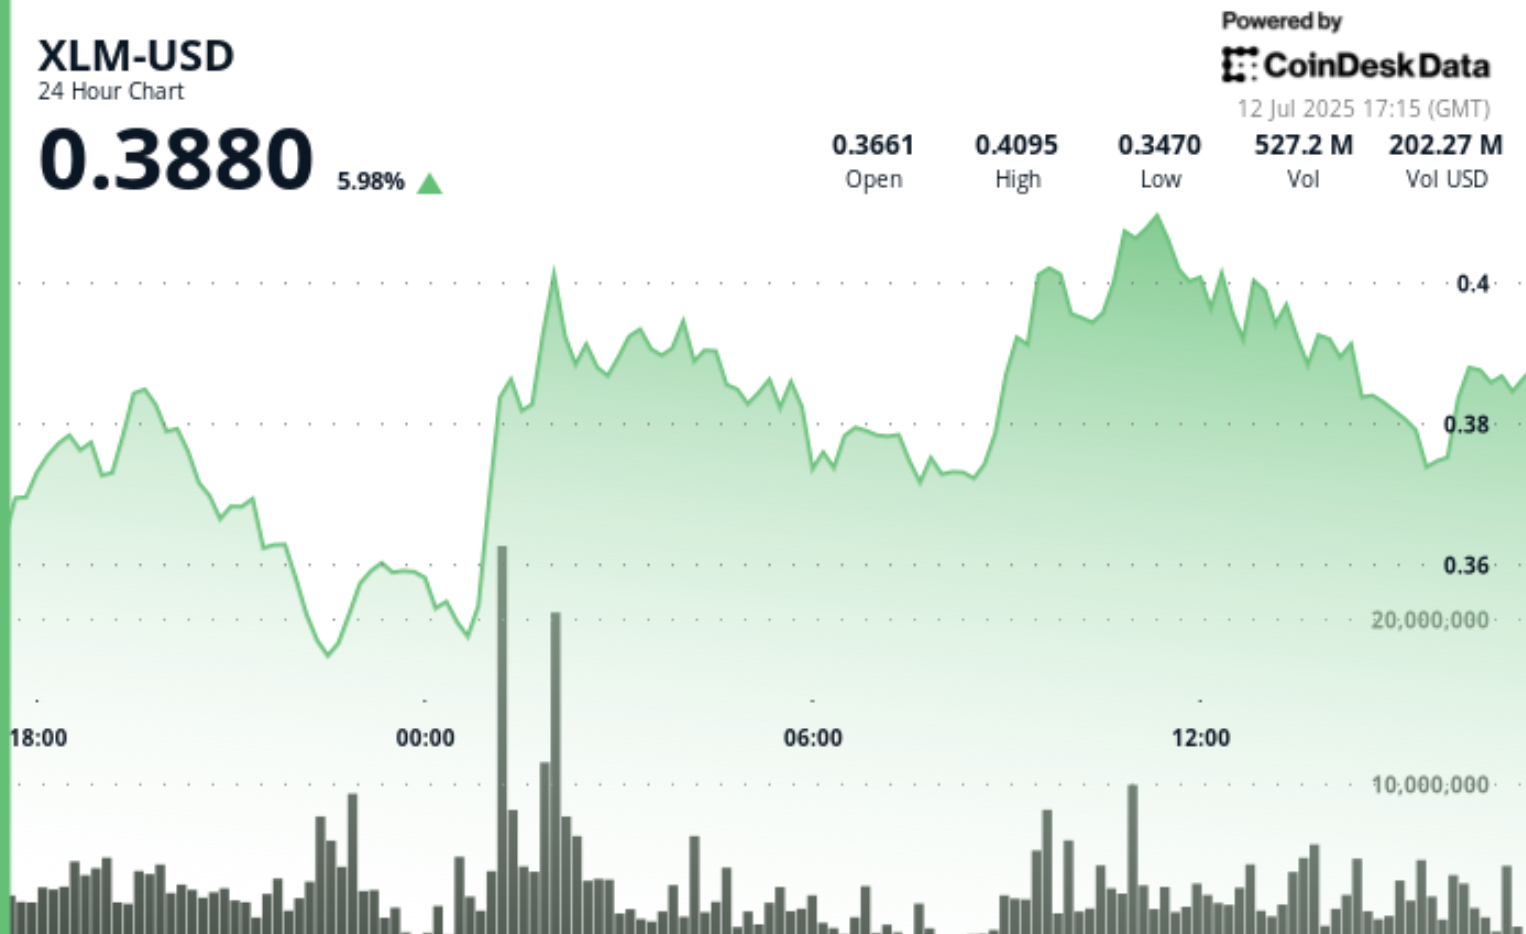
As per CMC data, XLM has gained about 13% over the past 24 hours, with a significant 300% rise in the daily trading volume. This increase in volume shows that there is a high institutional and retail interest, which supports the bullish story and implies that the current price action is supported by real market activity but not speculation.
The technical indicators show a very strong bullish scenario on various timeframes. XLM RSI is at 70, which is in the bullish zone but close to overbought. This reading indicates high bullish pressure with an indication that traders need to watch out for possible short-term consolidation or pullback.
What’s Next For Stellar Price?
The Moving Average Convergence Divergence (MACD) indicator is another confirmation of the bullish trend. The MACD line has become positive, and the histogram is green, and the MACD and signal lines are in an uptrend. This structure is usually an indication of a long-term trend upward and implies that the rally is not finished yet.
The social sentiment analysis shows a better perception of Stellar in the market, which is usually followed or accompanied by a major price change. The technical breakout, coupled with the positive change in the mood of the community, sets the stage for further price increases.
In terms of support and resistance, XLM has found a solid support at the price of $0.270, which is also the 200-day EMA. This is a crucial support level to the ongoing rally. The first level of resistance is at $0.334, which is a major psychological and technical point that, when broken, may lead to the opening of the upside momentum.
The combination of technical indicators, the higher trading volume, and the better sentiment indicates that the current bullish trend of Stellar might be sustainable. Nevertheless, traders are advised to be wary of the high RSI and watch out for any signals of momentum divergence around the resistance area.
Highlighted Crypto News Today:
After Soaring 8%, Will PEPE Continue Its Uptrend or Face a Roadblock on the Charts?
Read More
Stellar Performance From XLM as It Posts Top 24H Percentage Gain Among Top 20 Cryptos

Stellar Makes Epic Comeback Breaking 50-Day and 200-Day EMA Resistance
- Stellar (XLM) made a phenomenal comeback as the price breached the 50-day and 200-day EMA mark
- XLM MACD is positive with a green histogram, and the MACD and signal line are heading in the upward direction
Stellar (XLM) has shown an incredible recovery, surpassing key resistance points with strong momentum. The altcoin has managed to break the 50-day and 200-day EMAs, which is a major technical achievement, indicating a possible reversal of the earlier bearish mood.
As per CMC data, XLM has gained about 13% over the past 24 hours, with a significant 300% rise in the daily trading volume. This increase in volume shows that there is a high institutional and retail interest, which supports the bullish story and implies that the current price action is supported by real market activity but not speculation.
The technical indicators show a very strong bullish scenario on various timeframes. XLM RSI is at 70, which is in the bullish zone but close to overbought. This reading indicates high bullish pressure with an indication that traders need to watch out for possible short-term consolidation or pullback.
What’s Next For Stellar Price?
The Moving Average Convergence Divergence (MACD) indicator is another confirmation of the bullish trend. The MACD line has become positive, and the histogram is green, and the MACD and signal lines are in an uptrend. This structure is usually an indication of a long-term trend upward and implies that the rally is not finished yet.
The social sentiment analysis shows a better perception of Stellar in the market, which is usually followed or accompanied by a major price change. The technical breakout, coupled with the positive change in the mood of the community, sets the stage for further price increases.
In terms of support and resistance, XLM has found a solid support at the price of $0.270, which is also the 200-day EMA. This is a crucial support level to the ongoing rally. The first level of resistance is at $0.334, which is a major psychological and technical point that, when broken, may lead to the opening of the upside momentum.
The combination of technical indicators, the higher trading volume, and the better sentiment indicates that the current bullish trend of Stellar might be sustainable. Nevertheless, traders are advised to be wary of the high RSI and watch out for any signals of momentum divergence around the resistance area.
Highlighted Crypto News Today:
After Soaring 8%, Will PEPE Continue Its Uptrend or Face a Roadblock on the Charts?
Read More