Ethereum Exchange Supply At New All-Time Low, Investors Accumulating?

On-chain data shows the Ethereum exchange supply has declined to an all-time low recently, suggesting that investors may be accumulating.
Ethereum Supply On Exchanges Has Continued Its Downtrend Recently
According to data from the on-chain analytics firm Santiment, ETH on exchanges is now at its lowest since the cryptocurrency started trading publicly in July 2015. The “ETH supply on exchanges” is an indicator that measures the percentage of the total Ethereum circulating supply that’s currently sitting in the wallets of all centralized exchanges.
When the value of this metric goes up, it means the investors are depositing their coins in the wallets of exchanges currently. Since one of the main reasons why holders may transfer their ETH to these platforms is for selling-related purposes, this kind of trend can have bearish implications for the price.
On the other hand, a decrease in the indicator’s value implies the exchanges are observing the withdrawal of a net amount of the asset right now. Such a trend, when prolonged, can be a sign that the investors are accumulating, and hence, can have a bullish effect on the cryptocurrency’s value.
Now, here is a chart that shows the trend in the Ethereum supply on exchanges over the last few years:
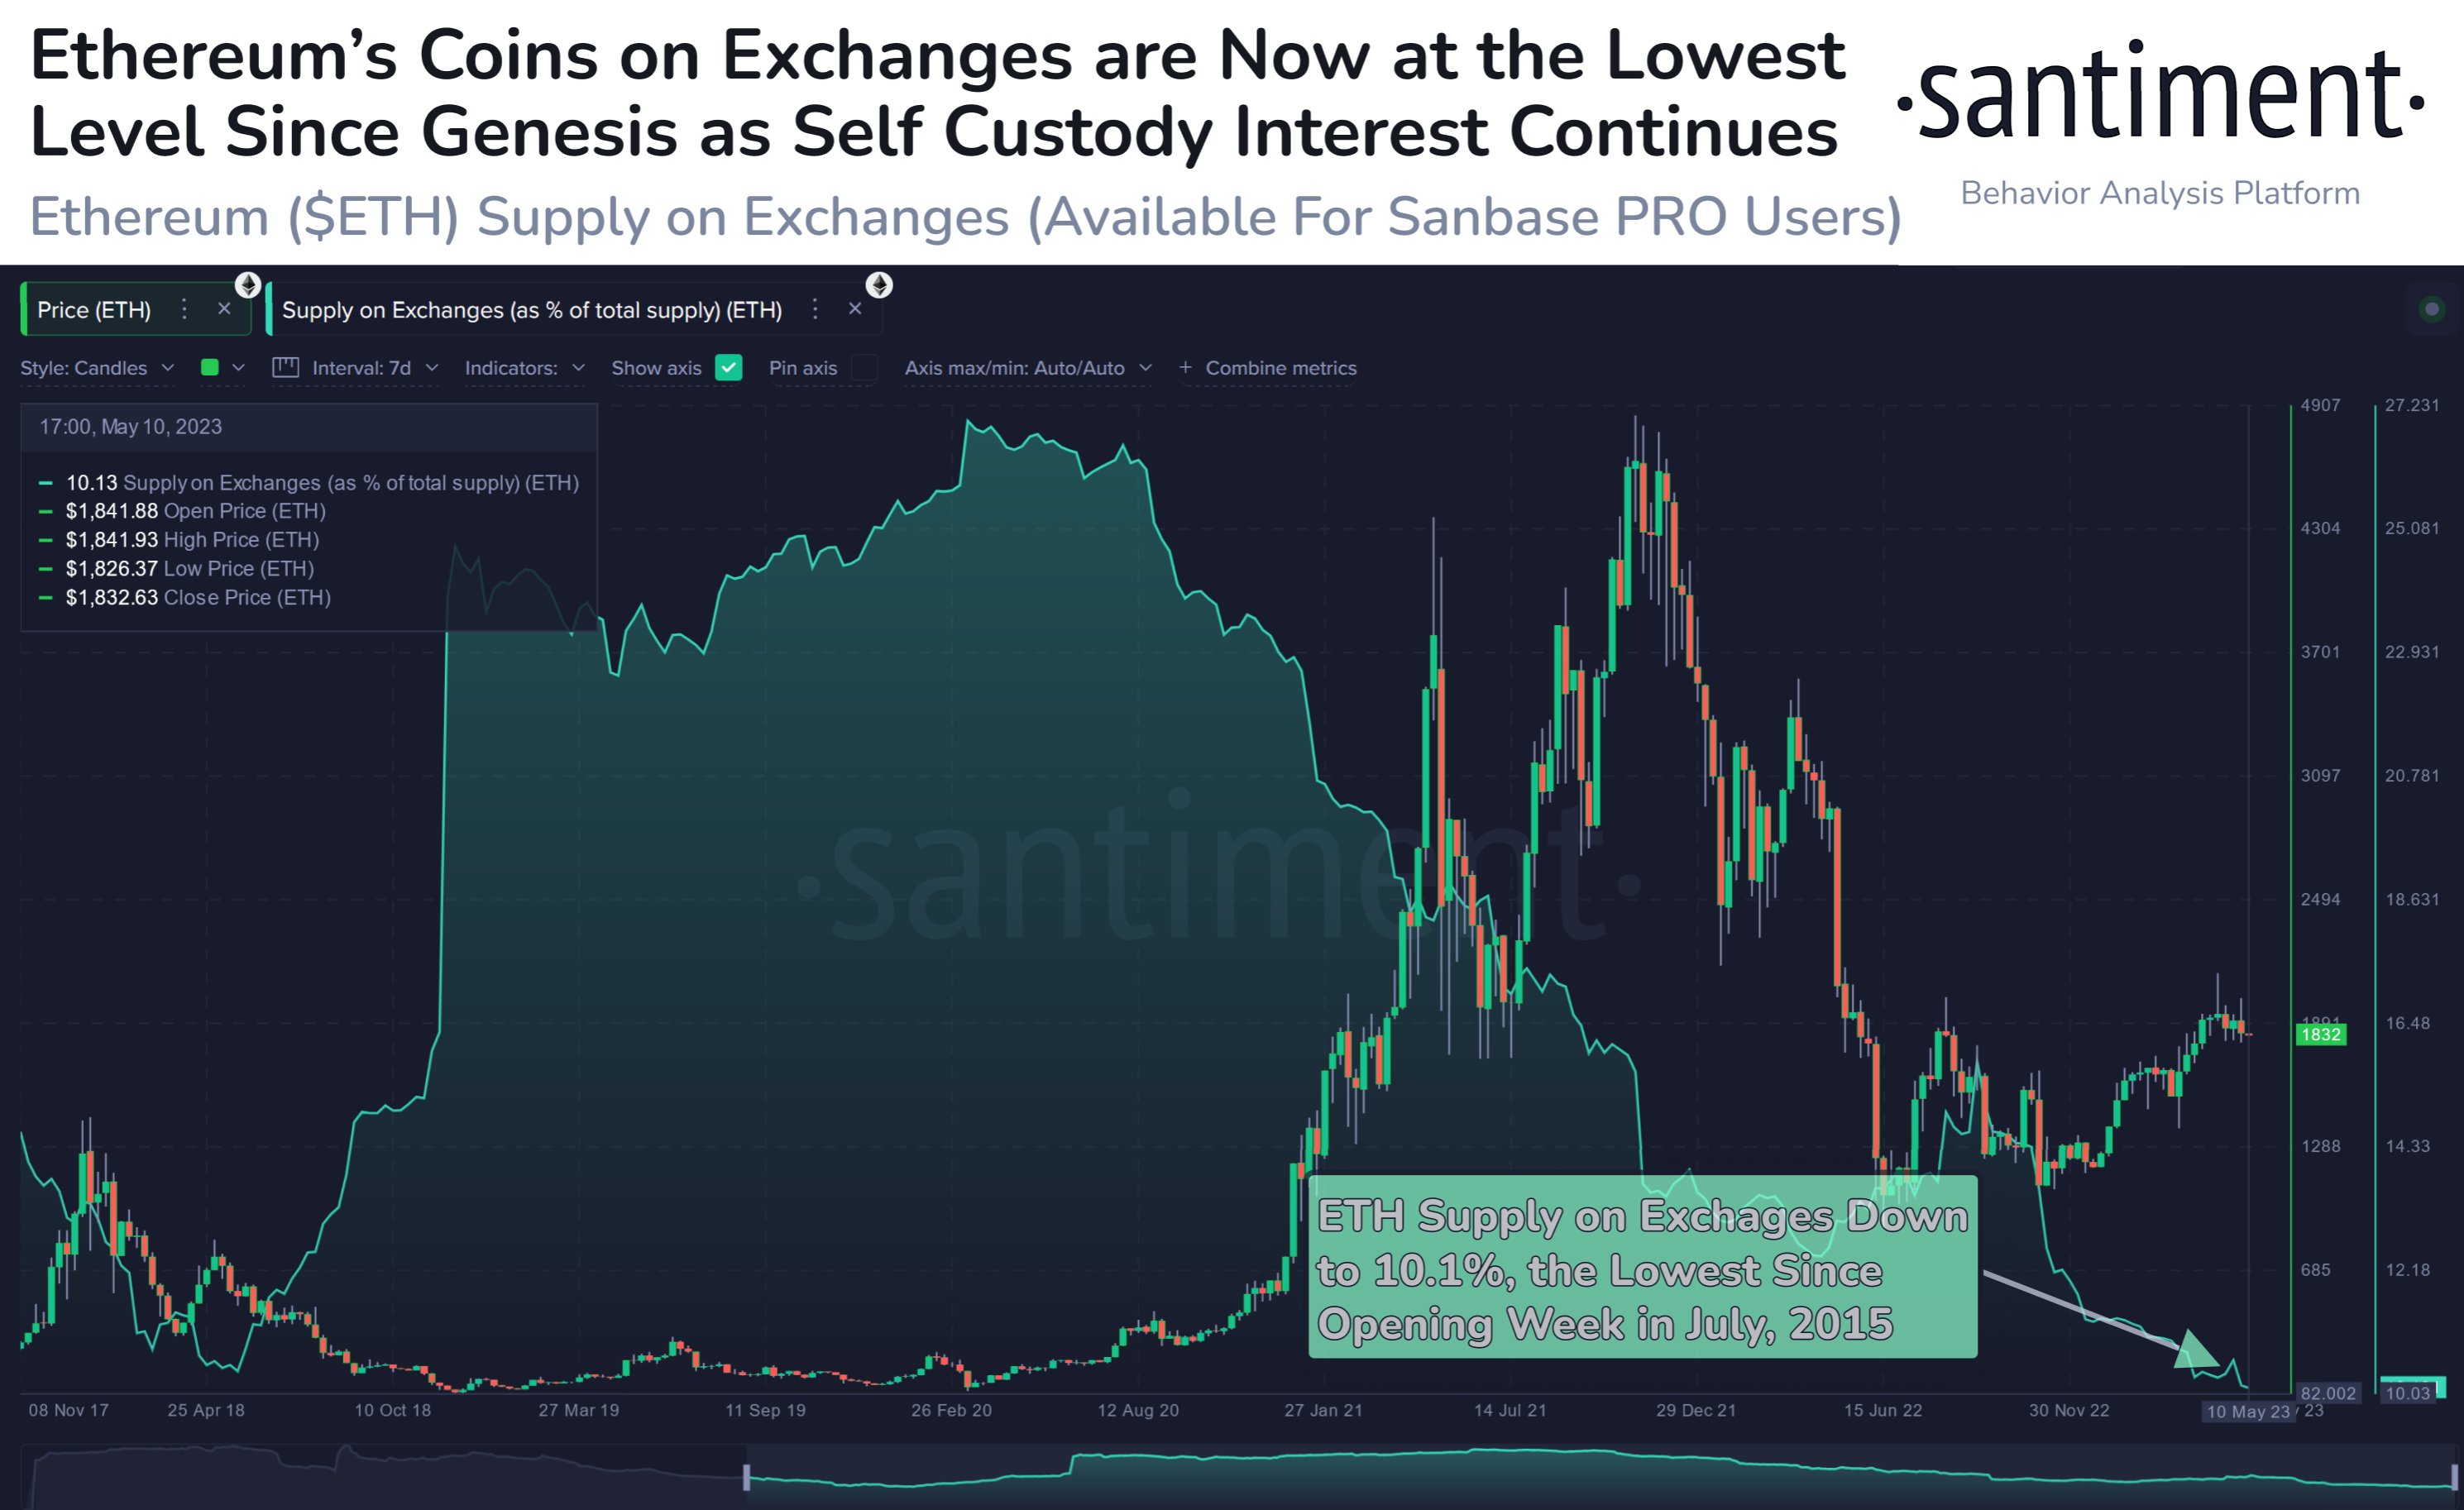
As displayed in the above graph, the Ethereum supply on exchanges has been going downhill for a few years now, suggesting that investors have been constantly withdrawing from these platforms.
The indicator has continued the drawdown while the rally has been taking place, but there was a temporary breakage in the trend just recently, where the metric briefly saw an increase. This rise wasn’t anything significant, but the fact that it occurred just as the latest decline in the price of the cryptocurrency came (which has now taken it below the $1,800 level) may be a sign that these deposits were made for selling.
However, it wasn’t long before the supply on exchanges resumed its downtrend, implying that fresh purchases may have taken place at the current relatively low prices.
Following this latest continuation in the overall downtrend of the Ethereum supply on exchanges, there is now just 10.1% of the total circulating supply left in the wallets of these platforms, which is the lowest value that the coin has seen since its opening week way back in July 2015.
This essential all-time low in the indicator could be a positive sign for the cryptocurrency in the long term, as it shows increasing awareness in the market around the risks of keeping their coins on centralized exchanges.
It’s currently unclear how long the current price drop may go on, but new withdrawals taking place might at the very least be a sign that there is still an availability of buyers in the market.
ETH Price
At the time of writing, Ethereum is trading around $1,700, down 10% in the last week.
Read More

Ethereum Price Prediction: ETH Coin Breaks $3K – Is $3,200 Next?

Ethereum Exchange Supply At New All-Time Low, Investors Accumulating?
On-chain data shows the Ethereum exchange supply has declined to an all-time low recently, suggesting that investors may be accumulating.
Ethereum Supply On Exchanges Has Continued Its Downtrend Recently
According to data from the on-chain analytics firm Santiment, ETH on exchanges is now at its lowest since the cryptocurrency started trading publicly in July 2015. The “ETH supply on exchanges” is an indicator that measures the percentage of the total Ethereum circulating supply that’s currently sitting in the wallets of all centralized exchanges.
When the value of this metric goes up, it means the investors are depositing their coins in the wallets of exchanges currently. Since one of the main reasons why holders may transfer their ETH to these platforms is for selling-related purposes, this kind of trend can have bearish implications for the price.
On the other hand, a decrease in the indicator’s value implies the exchanges are observing the withdrawal of a net amount of the asset right now. Such a trend, when prolonged, can be a sign that the investors are accumulating, and hence, can have a bullish effect on the cryptocurrency’s value.
Now, here is a chart that shows the trend in the Ethereum supply on exchanges over the last few years:
As displayed in the above graph, the Ethereum supply on exchanges has been going downhill for a few years now, suggesting that investors have been constantly withdrawing from these platforms.
The indicator has continued the drawdown while the rally has been taking place, but there was a temporary breakage in the trend just recently, where the metric briefly saw an increase. This rise wasn’t anything significant, but the fact that it occurred just as the latest decline in the price of the cryptocurrency came (which has now taken it below the $1,800 level) may be a sign that these deposits were made for selling.
However, it wasn’t long before the supply on exchanges resumed its downtrend, implying that fresh purchases may have taken place at the current relatively low prices.
Following this latest continuation in the overall downtrend of the Ethereum supply on exchanges, there is now just 10.1% of the total circulating supply left in the wallets of these platforms, which is the lowest value that the coin has seen since its opening week way back in July 2015.
This essential all-time low in the indicator could be a positive sign for the cryptocurrency in the long term, as it shows increasing awareness in the market around the risks of keeping their coins on centralized exchanges.
It’s currently unclear how long the current price drop may go on, but new withdrawals taking place might at the very least be a sign that there is still an availability of buyers in the market.
ETH Price
At the time of writing, Ethereum is trading around $1,700, down 10% in the last week.
Read More