Fartcoin Forms Bearish ‘M’ Pattern: 60% Crash Incoming?

Coinspeaker
Fartcoin Forms Bearish ‘M’ Pattern: 60% Crash Incoming?
FARTCOIN FARTCOIN $0.54 24h volatility: 6.8% Market cap: $539.25 M Vol. 24h: $284.45 M , the meme token that recently took the crypto community by storm, has started showing signs of exhaustion. At the time of writing, the sixth-largest cryptocurrency is trading at around $0.54, down by 6% in the past day.
FARTCOIN recently gained traction after surging 130% in the past month, even as broader crypto markets stayed relatively muted. Despite the latest pullback, the token’s market cap remains strong at $544 million—more than double what it was just a month ago.
However, popular analyst Ali Martinez recently noted a potential “M” pattern formation on the 12-hour chart since March 12. He warned that if the structure plays out, FARTCOIN could drop to $0.21.
Meanwhile, analytics platform CryptoRobotics notes strong buy-side volume clustering around the $0.50–$0.52 price band. According to their analysis, if the token holds above this demand zone, traders could see the price surging to the previous local high of $0.65.
FARTCOIN Price Outlook
On the 4-hour FARTCOIN price chart, the RSI currently hovers around 56, suggesting that buyers and sellers are evenly matched for now. A further upward move could lead to a short-term bullish momentum.
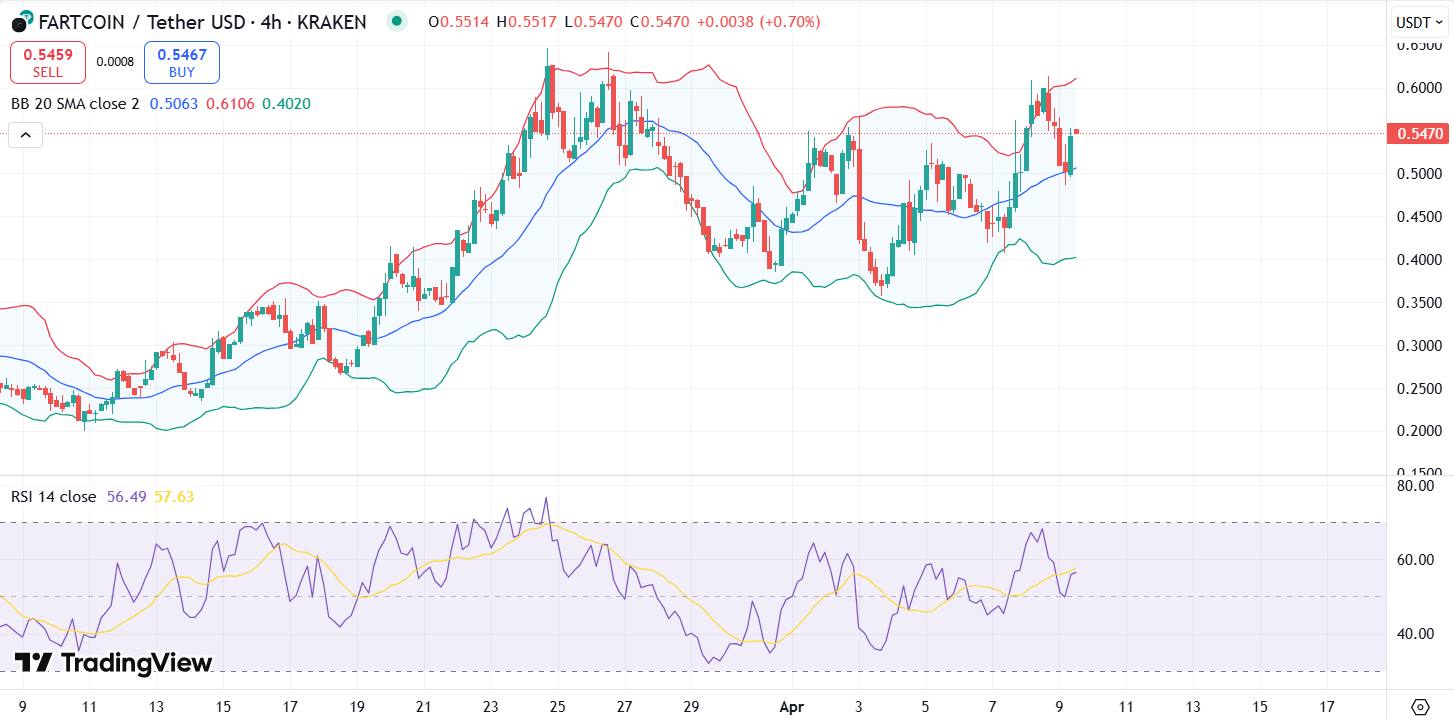
The Bollinger Bands show that FARTCOIN is testing the midline around $0.51 after bouncing off the lower band on April 7. If the meme coin closes sustainably above the midline, it could retest the upper band near $0.61.
However, failure to hold above the $0.52–$0.50 zone could result in a slide toward $0.44.
Meanwhile, the MACD recently flashed a bullish crossover, with the blue MACD line rising above the orange signal line.
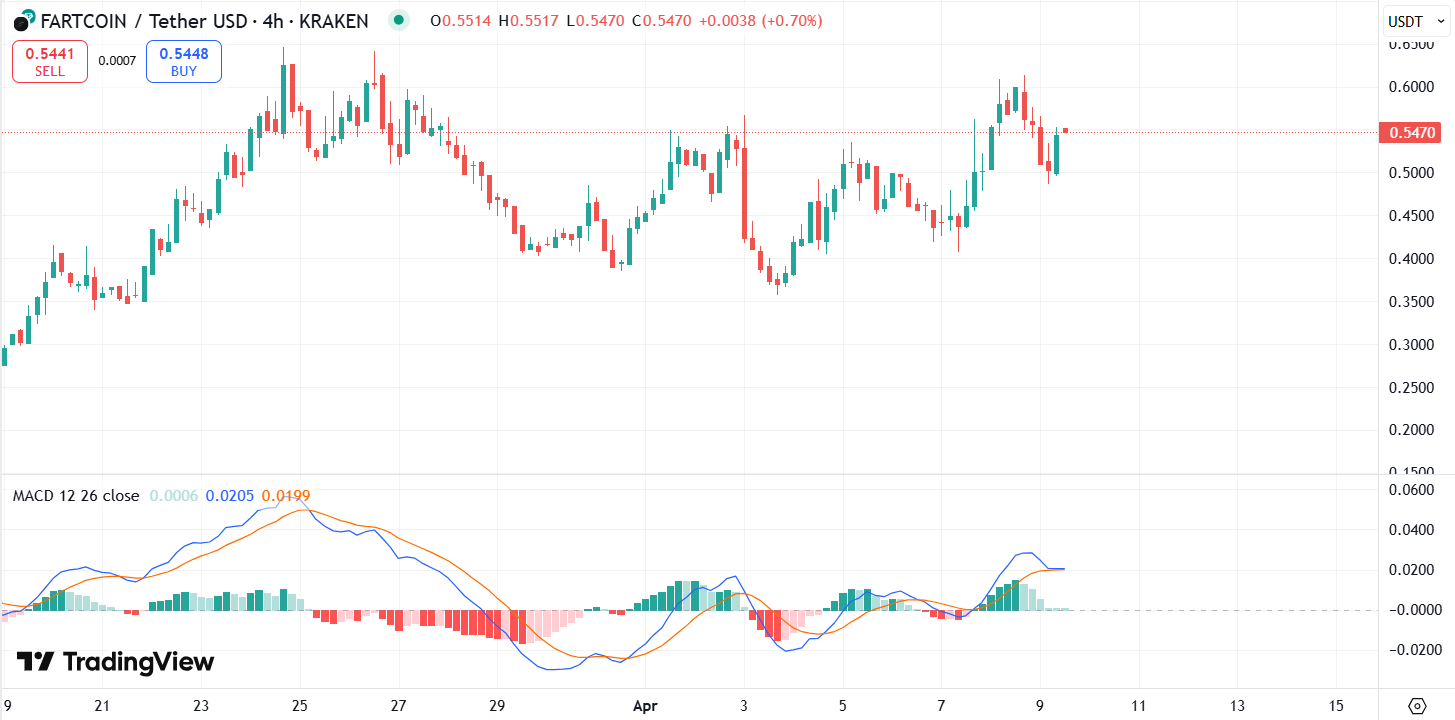
However, the histogram bars are flattening, suggesting that momentum may be fading. Notably, FARTCOIN’s 24-hour trading volume has seen a 17% drop, as per the data by CoinMarketCap.
It is important to note that market analyst Crypto General recently stated that FARTCOIN is currently consolidating below the breakout zone at $0.58. They predicted a bold price target of $10 for the meme coin, a nearly 20x jump from current levels.
Read More


Fartcoin Forms Bearish ‘M’ Pattern: 60% Crash Incoming?
Coinspeaker
Fartcoin Forms Bearish ‘M’ Pattern: 60% Crash Incoming?
FARTCOIN FARTCOIN $0.54 24h volatility: 6.8% Market cap: $539.25 M Vol. 24h: $284.45 M , the meme token that recently took the crypto community by storm, has started showing signs of exhaustion. At the time of writing, the sixth-largest cryptocurrency is trading at around $0.54, down by 6% in the past day.
FARTCOIN recently gained traction after surging 130% in the past month, even as broader crypto markets stayed relatively muted. Despite the latest pullback, the token’s market cap remains strong at $544 million—more than double what it was just a month ago.
However, popular analyst Ali Martinez recently noted a potential “M” pattern formation on the 12-hour chart since March 12. He warned that if the structure plays out, FARTCOIN could drop to $0.21.
Meanwhile, analytics platform CryptoRobotics notes strong buy-side volume clustering around the $0.50–$0.52 price band. According to their analysis, if the token holds above this demand zone, traders could see the price surging to the previous local high of $0.65.
FARTCOIN Price Outlook
On the 4-hour FARTCOIN price chart, the RSI currently hovers around 56, suggesting that buyers and sellers are evenly matched for now. A further upward move could lead to a short-term bullish momentum.
The Bollinger Bands show that FARTCOIN is testing the midline around $0.51 after bouncing off the lower band on April 7. If the meme coin closes sustainably above the midline, it could retest the upper band near $0.61.
However, failure to hold above the $0.52–$0.50 zone could result in a slide toward $0.44.
Meanwhile, the MACD recently flashed a bullish crossover, with the blue MACD line rising above the orange signal line.
However, the histogram bars are flattening, suggesting that momentum may be fading. Notably, FARTCOIN’s 24-hour trading volume has seen a 17% drop, as per the data by CoinMarketCap.
It is important to note that market analyst Crypto General recently stated that FARTCOIN is currently consolidating below the breakout zone at $0.58. They predicted a bold price target of $10 for the meme coin, a nearly 20x jump from current levels.
Read More